"What is a good average view duration?" is one of the most searched questions about YouTube analytics, and the honest answer is: it depends. That is not a dodge. The same number can be great for one video and disappointing for another. This article explains what the numbers mean, how to judge your own and what actually moves them.
Three numbers that are easy to mix up
- Average view duration (AVD): how long people watch a video on average, in minutes and seconds. A 10-minute video with an AVD of 4:00 is watched for four minutes per view.
- Average percentage viewed: the same thing as a share of the video. Four minutes of a 10-minute video is 40%.
- Audience retention: the graph in YouTube Studio that shows, second by second, how many viewers are still watching.
You find all three in YouTube Studio: open a video, go to Analytics and then the Engagement tab.
Why there is no single "good" number
Percentages naturally drop as videos get longer. Almost everyone finishes a 30-second clip; very few people watch a 40-minute documentary to the end. Compare these two videos:
- A 2-minute video watched for 80%: 1 minute 36 seconds per view
- A 10-minute video watched for 40%: 4 minutes per view
The first has the better percentage, but the second gives each viewer two and a half times as much watch time. And watch time is what counts for the YouTube Partner Program.
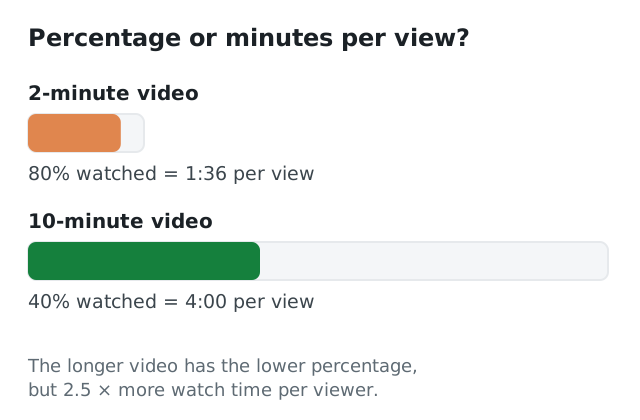
A lower percentage can still mean far more watch time per viewer.
Niche matters as well. Tutorials are often skipped through to the step someone needs. Stories and entertainment are watched more from start to finish. Music is replayed. Comparing your cooking tutorial with someone else's gaming stream tells you nothing.
Rough guidelines (use them carefully)
YouTube doesn't publish benchmarks, but these rules of thumb are widely used by creators:
- For videos under 5 minutes, keeping more than half your viewers on average is strong.
- For videos of 8 to 15 minutes, 35 to 50% is solid, and an AVD of 4 minutes or more is a good sign.
- For videos over 20 minutes, 25 to 35% can already be very good, because the minutes per viewer add up fast.
Treat these as a starting point, not a verdict. The comparison that matters most is with your own videos.
Compare with yourself, not with the internet
YouTube Studio compares each new video with how your channel usually performs, and the retention graph can show whether a video holds viewers better or worse than your typical videos of similar length. That is the useful comparison: your audience, your niche, your style. If your last five videos averaged 3:10 and the new one does 4:20, you did something right. Find out what.
How to read the retention graph
The shape of the graph tells you more than the average does:
- A steep drop in the first 30 seconds: the opening doesn't match what the title and thumbnail promised, or it takes too long to get going. This is the most common problem, and the easiest to fix.
- A slow, steady decline: normal. Some people always leave. The flatter the line, the better.
- A sudden dip in the middle: something there makes people leave: a long sponsor segment, a slow tangent, a repeated explanation. Watch that part back with fresh eyes.
- A bump upward: people rewind or skip to that moment. It's interesting. Consider making more videos about it, or moving it earlier.
- A big drop near the end: people leave when they sense the video is wrapping up. A long outro costs you; get to the end screen faster.
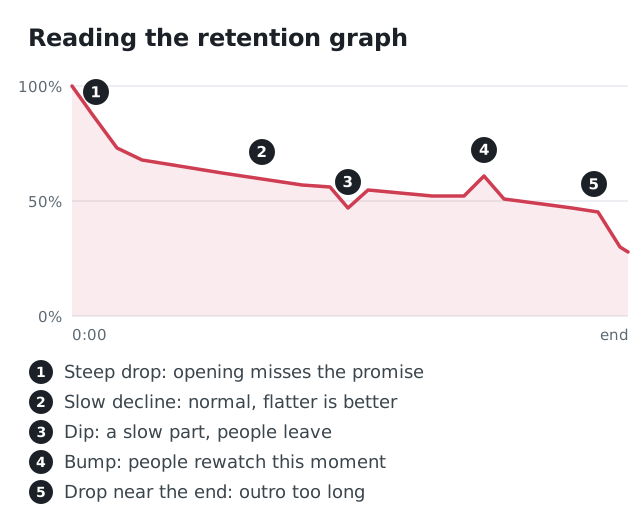
An example retention graph. Its shape tells you more than the average does.
7 ways to improve your average view duration
1. Fix the first 30 seconds
Start with the most interesting thing: the result, the question, the conflict. Cut "hey guys, welcome back" intros and logo animations. Tell people within seconds what they'll get and why they should stay until the end.
2. Keep the promise of your title and thumbnail
If people click for X and get Y, they leave, no matter how good Y is. The more closely the start of the video matches the promise, the flatter your graph. (See titles and thumbnails for how to set the right expectation.)
3. Cut ruthlessly
Every pause, repeated sentence and "um" is a moment where viewers can drift off. Most videos get better when they are 10 to 20% shorter. Watch your edit at 1.5× speed: if you get bored, so will your viewers.
4. Give people a reason to stay
Tease what is coming ("the third tip is the one that saved me the most money"), build towards a result, or use a list format that people want to finish. Small open loops keep viewers watching.
5. Change something every 20 to 40 seconds
A new angle, a close-up, a graphic, a change of location or pace. These pattern interrupts reset attention, especially in talking-head videos.
6. Add chapters
Chapters let people jump to the part they need. That may sound like less watch time, but people who find what they want quickly are less likely to leave altogether, and chapters make long videos less intimidating to start.
7. Learn from your best video
Open the retention graph of your best-performing video next to your average one. What is different in the first minute? The pace, the topic, the structure? Do more of that.
Where Viewtrader helps
The opening is where most viewers are won or lost, and it is hard to judge your own. Viewtrader's Hook doctor reads the title and the first minute of your subtitles or script, explains what holds the opening back and writes three stronger openings for the first 30 seconds. Use one when you record or edit. It is one of Viewtrader's AI creator tools.
A view campaign on Viewtrader is different from a click: members watch your video for the length you choose, and our extension checks it before they earn credits. It is a way to get a new video watched by real creators while you work on the openings and edits above. Choose a view length that fits your video rather than the maximum.
In short
- Average view duration is minutes per view; percentage viewed is the share of the video
- Longer videos have lower percentages, but often more watch time per viewer
- Compare with your own channel and similar videos, not with numbers online
- The retention graph shows where people leave; the first 30 seconds matter most
- Strong openings, honest promises and tight edits move the number most